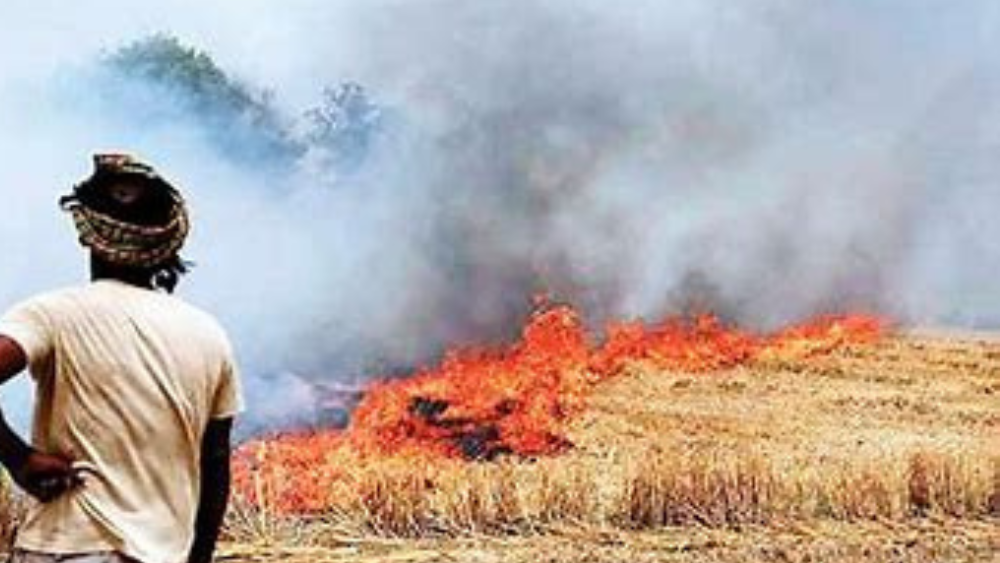
Farm stubble burning
QUESTION
(a) the number of incidents of farm stubble burning since October 2023 till date, Statewise;
(b) whether it is a fact that the air quality in many cities has deteriorated over the years, if
so, the list of cities where AQI has increased in the recent years ;
(c) the percentage contribution of various factors responsible for air pollution in the norther
n region during winter season; and
(d) the total expenditure incurred by Government in prevention and mitigation of air
pollution?
ANSWER
MINISTER OF STATE IN THE MINISTRY OF ENVIRONMENT, FOREST AND CLIMATE
CHANGE
(SHRI ASHWINI KUMAR CHOUBEY
(a)The commission for Air Quality Management in NCR & Adjoining Areas has provided a
framework for the prevention and control of Air pollution in Delhi NCR &Adjoining Areas which
impacts the air quality of the NCT Delhi. State-wise paddy stubble burning incidents recorded
between 01st October 2023- 30thNov 2023, are as follows:
| Punjab | Haryana | UP-NCR | Rajasthan NCR | Delhi |
| 36449 | 2228 | 209 | 2 | 4 |
Owing to concerted efforts by all stakeholders and constant monitoring and reviews by the Central Govt., the number of paddy stubble burning incidents between 15thSeptember –30thNovember,2023 witnessed an overall reduction of about 27% as compared to the corresponding period in 2022.
(b): The data of Air Quality Index (AQI) shows that in all Delhi – NCR cities, there are more number of days in Poor, Very Poor and Severe category of AQI during recent time i.e. November month of 2023 except in 4 cities namely Mandikhera, Palwal, Alwar&Khurja as compared to other cities in Delhi – NCR.
The data of AQI during November month of 2022 also shows that in all Delhi – NCR cities there are more number of days in Poor, Very Poor and Severe category of AQI except in 9 cities namely Mandikhera, Palwal, Alwar, Khurja, CharkhiDadri, Karnal Narnaul, Panipat and Hapur as compared to other cities in Delhi – NCR.
The air quality during November 2023 may be attributed to prevailing meteorological conditions and contribution from local and regional emission sources. The AQI of Delhi & NCR cities for the month of November, 2023 and 2022 are presented Annexure – I & Annexure-II, respectively.
(c): The major sources of air pollution in Delhi NCR which aggravate during the winter due to unfavourable meteorological conditions include industrial pollution, vehicular pollution, dust from construction and demolition activities, road and open areas dust, stubble burning, municipal solid waste burning, etc. As per TERI-ARAI Source Apportionment study of year 2016 published in 2018, contribution of various sources to PM 2.5 and PM 10 levels in Delhi is given below:
| Source | % contribution (PM10) | % contribution (PM2.5) | ||
| Winter | Summer | Winter | Summer | |
| Residential | 9% | 8% | 10% | 8% |
| Agri. Burning* | 4% | 7% | 4% | 7% |
| Industry | 27% | 22% | 30% | 22% |
| Dust (soil, road, and const.) | 25% | 42% | 17% | 38% |
| Transport | 24% | 15% | 28% | 17% |
| Others | 10% | 7% | 11% | 8% |
Note: Industries include power plants (stacks, flyash ponds and coal handling units), brick manufacturing, stone crushers, and other industries. Others include DG sets, refuse burning, crematoria, airport, restaurants, incinerators, landfills, etc. Dust includes sources of natural and anthropogenic origin (soil, road dust re-suspension, and construction activities). Dust is also contributed through trans-boundary atmospheric transport from international boundaries.
It is to be noted that the contribution of agricultural burning is not fully accounted for in this study as the monitoring and modelling periods did not include the month of October, when the burning activities are generally at their maximum. Moreover, the sectoral contributions are averaged for the whole modelling/monitoring period, and hence, do not highlight the contribution of agricultural burning, which happens during a certain number of days and cause episodically high pollutant concentrations.
(d): Government has launched National Clean Air Programme (NCAP) in 2019 as a national level strategy to reduce air pollution levels across the country. Under this programme, an amount of Rs.9650 crore was released to 131 cities to implement City Action Plans during the FY 2019-20 to 2023-24 (till 15th Dec, 2023) to take measures for improving air quality in these cities.
Number of days in different category of AQI during November, 2023 of Delhi & NCR Cities
|
S.No |
City |
Good |
Satisfacto
ry |
Moderat
e |
Poor |
Very Poor |
Severe |
Good Days |
Bad Days |
|
(0–50) |
(51–100) |
(101–
200) |
(201–300) |
(301–400) |
(>401) |
||||
| 1 | Delhi | 0 | 0 | 0 | 4 | 17 | 9 | 0 | 30 |
| 2 | Bhiwani | 0 | 0 | 4 | 9 | 17 | 0 | 4 | 26 |
|
3 |
CharkhiDa
dri |
0 |
1 |
5 |
12 |
7 |
0 |
6 |
19 |
| 4 | Ballabgarh | 0 | 0 | 3 | 13 | 12 | 0 | 3 | 25 |
| 5 | Manesar | 0 | 0 | 3 | 9 | 18 | 0 | 3 | 27 |
| 6 | Faridabad | 0 | 0 | 2 | 2 | 17 | 9 | 2 | 28 |
| 7 | Gurugram | 0 | 0 | 3 | 8 | 16 | 3 | 3 | 27 |
|
8 |
Bahadurga
rh |
0 |
0 |
3 |
5 |
18 |
2 |
3 |
25 |
| 9 | Jind | 0 | 1 | 2 | 7 | 12 | 6 | 3 | 25 |
| 10 | Karnal | 0 | 1 | 10 | 11 | 6 | 0 | 11 | 17 |
| 11 | Narnaul | 0 | 0 | 5 | 12 | 10 | 2 | 5 | 24 |
|
12 |
Mandikher
a |
0 |
2 |
19 |
4 |
1 |
0 |
21 |
5 |
| 13 | Palwal | 0 | 3 | 17 | 7 | 1 | 0 | 20 | 8 |
| 14 | Panipat | 0 | 0 | 12 | 9 | 7 | 0 | 12 | 16 |
| 15 | Dharuhera | 0 | 0 | 6 | 6 | 18 | 0 | 6 | 24 |
| 16 | Rohtak | 0 | 1 | 2 | 5 | 20 | 2 | 3 | 27 |
| 17 | Sonipat | 0 | 1 | 5 | 6 | 12 | 4 | 6 | 22 |
| 18 | Alwar | 0 | 3 | 13 | 13 | 0 | 0 | 16 | 13 |
| 19 | Bharatpur | 0 | 0 | 2 | 15 | 12 | 0 | 2 | 27 |
| 20 | Bhiwadi | 0 | 0 | 1 | 8 | 16 | 5 | 1 | 29 |
| 21 | Baghpat | 0 | 0 | 2 | 10 | 17 | 0 | 2 | 27 |
| 22 | Khurja | 0 | 9 | 14 | 5 | 1 | 0 | 23 | 6 |
|
23 |
Bulandsha
hr |
0 |
1 |
6 |
18 |
4 |
0 |
7 |
22 |
| 24 | Noida | 0 | 0 | 2 | 5 | 19 | 4 | 2 | 28 |
|
25 |
Greater
Noida |
0 |
0 |
2 |
5 |
15 |
8 |
2 |
28 |
| 26 | Ghaziabad | 0 | 0 | 2 | 8 | 18 | 2 | 2 | 28 |
| 27 | Hapur | 0 | 0 | 4 | 14 | 11 | 0 | 4 | 25 |
| 28 | Meerut | 0 | 0 | 2 | 5 | 22 | 1 | 2 | 28 |
|
29 |
Muzaffarn
agar |
0 |
0 |
7 |
21 |
2 |
0 |
7 |
23 |
Number of days in different category of AQI during November, 2022 of Delhi & NCR Cities
| S.N
o |
City |
Good | Satisfactor
y |
Moderate | Poor | Very Poor | Sever
e |
Good Days | Bad Days |
| (0–50) | (51–100) | (101–200) | (201–300) | (301–400) | (>401) | ||||
| 1 | Delhi | 0 | 0 | 0 | 12 | 15 | 3 | 0 | 30 |
| 2 | Bhiwani | 0 | 2 | 8 | 14 | 3 | 2 | 10 | 19 |
| 3 | CharkhiDadri | 0 | 1 | 16 | 8 | 2 | 3 | 17 | 13 |
| 4 | Ballabgarh | 0 | 0 | 6 | 16 | 8 | 0 | 6 | 24 |
| 5 | Manesar | 0 | 0 | 10 | 16 | 2 | 1 | 10 | 19 |
| 6 | Faridabad | 0 | 0 | 1 | 15 | 12 | 2 | 1 | 29 |
| 7 | Gurugram | 0 | 0 | 1 | 18 | 9 | 2 | 1 | 29 |
| 8 | Bahadurgarh | 0 | 0 | 5 | 19 | 3 | 2 | 5 | 24 |
| 9 | Jind | 0 | 0 | 1 | 20 | 7 | 2 | 1 | 29 |
| 10 | Karnal | 0 | 3 | 14 | 9 | 2 | 0 | 17 | 11 |
| 11 | Narnaul | 0 | 2 | 19 | 8 | 1 | 0 | 21 | 9 |
| 12 | Mandikhera | 1 | 12 | 15 | 1 | 1 | 0 | 28 | 2 |
| 13 | Palwal | 2 | 19 | 7 | 0 | 0 | 0 | 28 | 0 |
| 14 | Panipat | 2 | 19 | 7 | 0 | 0 | 0 | 28 | 0 |
| 15 | Dharuhera | 0 | 0 | 1 | 12 | 9 | 1 | 1 | 22 |
| 16 | Rohtak | 1 | 1 | 9 | 15 | 1 | 2 | 11 | 18 |
| 17 | Sonipat | 0 | 0 | 7 | 12 | 8 | 0 | 7 | 20 |
| 18 | Alwar | 0 | 18 | 9 | 3 | 0 | 0 | 27 | 3 |
| 19 | Bharatpur | – | – | – | – | – | – | – | – |
| 20 | Bhiwadi | 0 | 0 | 10 | 13 | 5 | 2 | 10 | 20 |
| 21 | Baghpat | 0 | 0 | 4 | 15 | 7 | 0 | 4 | 22 |
| 22 | Khurja | 0 | 3 | 17 | 9 | 1 | 0 | 20 | 10 |
| 23 | Bulandshahr | 0 | 0 | 8 | 21 | 1 | 0 | 8 | 22 |
| 24 | Noida | 0 | 0 | 6 | 13 | 9 | 2 | 6 | 24 |
| 25 | Greater Noida | 0 | 0 | 3 | 13 | 9 | 5 | 3 | 27 |
| 26 | Ghaziabad | 0 | 0 | 5 | 13 | 10 | 2 | 5 | 25 |
| 27 | Hapur | 0 | 0 | 18 | 8 | 1 | 0 | 18 | 9 |
| 28 | Meerut | 0 | 0 | 3 | 24 | 3 | 0 | 3 | 27 |
| 29 | Muzaffarnagar | 0 | 0 | 6 | 14 | 6 | 0 | 6 | 20 |


RELATED QUESTIONS