FOREIGN INVESTMENT IN INDIA
Questions :
Will the Minister of Commerce and Industry be pleased to state:
- the steps taken by Government since June 2019 to attract foreign investors, the details thereof;
- whether the steps taken by Government have increased foreign investment in India;
- if so, the details thereof, year-wise; and
- the quantum of foreign investment that has come into India since June 2019, the details thereof, sector-wise?
ANSWER
THE MINISTER OF STATE IN THE MINISTRY OF COMMERCE & INDUSTRY (SHRI SOM PARKASH)
- : To promote foreign investment, the Government has put in place an investor friendly policy, wherein most sectors, except certain strategically important sectors, are open for 100% FDI under the automatic route. Almost 98% of FDI equity inflow has come under automatic route during the current financial year 2022-23 (up to December, 2022). Further, the FDI policy is reviewed on an ongoing basis, to ensure that India remains an attractive and investor friendly destination. Changes are made in the policy after having consultations with stakeholders including apex industry chambers, associations, representatives of industries/groups and other organizations.
Since June 2019, FDI Policy reforms have been undertaken in various sectors such as Coal Mining, Contract Manufacturing, Single Brand Retail Trading, Digital Media, Insurance, Civil Aviation, Defence, Petroleum and Natural Gas and Telecommunications. Further, all proposals seeking Government approval under FDI route are now filed on National Single Window System (NSWS) Portal.
Further, investment outreach activities are done through Ministries, State Governments and Indian Missions abroad for enhancing international cooperation and promoting foreign investment in the country.
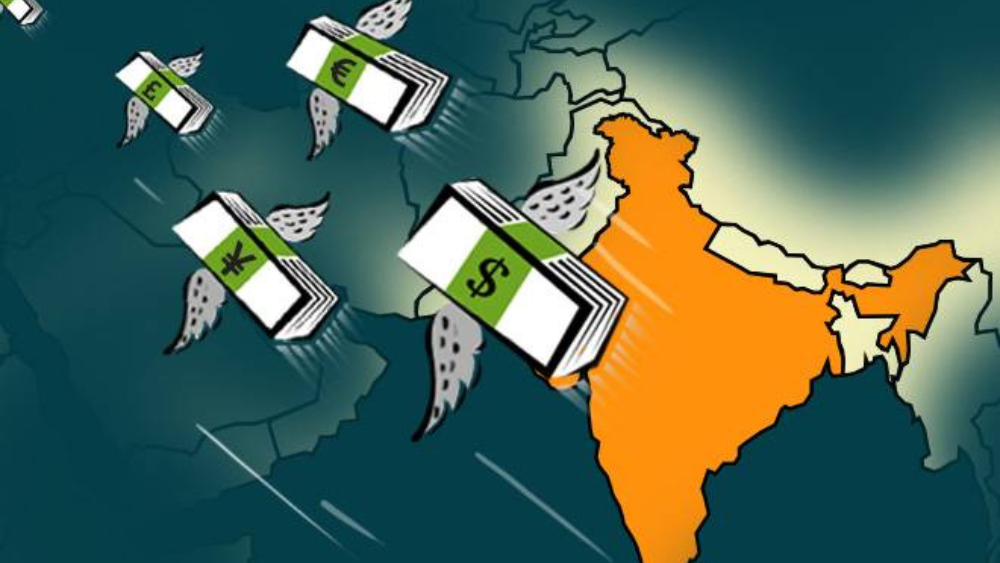
- : Measures taken by the Government on FDI Policy reforms have resulted in increased FDI inflow in the country. FDI inflow in India stood at approximately USD 45 billion in 2014-15 and has continuously increased since India registered its highest ever annual FDI inflow of approximately USD 85 billion (provisional figures) in the financial year 2021-22. These trends in India’s FDI are an endorsement of its status as a preferred investment destination amongst global investors.
- : Financial Year-wise details of total FDI inflow reported since June, 2019 till December, 2022 are as under:
| S. No. | Financial Year | Amount of FDI inflow (in USD billion) |
| (1) | (2) | (3) |
| 1 | 2019-20 (June, 2019 –March, 2020) | 62 |
| 2 | 2020-21 | 82 |
| 3 | 2021-22 (P) | 85 |
| 4 | 2022-23 (P) (up to December, 2022) | 55 |
- : Since June 2019 India has received total FDI inflow of approximately USD 284 billion till December 2022. Total FDI inflow includes equity inflow, equity capital of unincorporated bodies, re-invested earnings, and other The sector-wise details are maintained only for equity component of total FDI inflow. Accordingly, the sector-wise details of FDI Equity inflow since June 2019 till December 2022 are as under:
| STATEMENT ON SECTOR-WISE FDI EQUITY INFLOW FROM June 2019
TO December 2022 |
|||
| S.
No. |
Sector |
Amount of FDI Equity Inflow (In USD Million) | %age with Inflow |
| (1) | (2) | (3) | (4) |
| 1 | COMPUTER SOFTWARE &
HARDWARE |
54,578 | 28 |
|
2 |
SERVICES SECTOR (Fin., Banking,
Insurance, Non Fin/Business, Outsourcing, R&D, Courier, Tech. Testing and Analysis, Other) |
24,716 |
13 |
| 3 | TRADING | 15,238 | 8 |
| 4 | CONSTRUCTION (INFRASTRUCTURE) ACTIVITIES | 14,039 | 7 |
| 5 | AUTOMOBILE INDUSTRY | 11,833 | 6 |
| 6 | EDUCATION | 6,487 | 3 |
| 7 | TELECOMMUNICATIONS | 6,100 | 3 |
|
8 |
METALLURGICAL INDUSTRIES |
5,851 |
3 |
| 9 | NON-CONVENTIONAL ENERGY | 5,277 | 3 |
| 10 | DRUGS & PHARMACEUTICALS | 5,066 | 3 |
| 11 | CHEMICALS (OTHER THAN
FERTILIZERS) |
4,295 | 2 |
| 12 | HOTEL & TOURISM | 3,789 | 2 |
| 13 | CONSULTANCY SERVICES | 3,578 | 2 |
| 14 | ELECTRICAL EQUIPMENTS | 3,374 | 2 |
| 15 | RETAIL TRADING | 2,591 | 1 |
| 16 | FOOD PROCESSING INDUSTRIES | 2,430 | 1 |
| 17 | HOSPITAL & DIAGNOSTIC
CENTRES |
2,182 | 1 |
| 18 | POWER | 2,077 | 1 |
| 19 | MISCELLANEOUS INDUSTRIES | 1,967 | 1 |
| 20 | AIR TRANSPORT (INCLUDING AIR
FREIGHT) |
1,836 | 1 |
|
21 |
INFORMATION &
BROADCASTING (INCLUDING PRINT MEDIA) |
1,627 |
1 |
| 22 | FERMENTATION INDUSTRIES | 1,451 | 1 |
| 23 | ELECTRONICS | 1,288 | 1 |
|
24 |
CONSTRUCTION DEVELOPMENT:
Townships, housing, built-up infrastructure and construction- development projects |
1,244 |
1 |
| 25 | SEA TRANSPORT | 1,208 | 1 |
| 26 | AGRICULTURAL MACHINERY | 1,187 | 1 |
| 27 | INDUSTRIAL MACHINERY | 1,147 | 1 |
| 28 | PETROLEUM & NATURAL GAS | 1,003 | 1 |
| 29 | MEDICAL AND SURGICAL
APPLIANCES |
930 | 0.47 |
|
30 |
TEXTILES (INCLUDING DYED,PRINTED) |
861 |
0.44 |
| 31 | SOAPS, COSMETICS & TOILET
PREPARATIONS |
797 | 0.41 |
| 32 | MINING | 758 | 0.39 |
|
33 |
PRINTING OF BOOKS
(INCLUDING LITHO PRINTING INDUSTRY) |
720 |
0.37 |
| 34 | GLASS | 691 | 0.35 |
| 35 | MISCELLANEOUS MECHANICAL
& ENGINEERING INDUSTRIES |
597 | 0.30 |
| 36 | AGRICULTURE SERVICES | 559 | 0.29 |
| 37 | RUBBER GOODS | 548 | 0.28 |
| 38 | PRIME MOVER (OTHER THAN
ELECTRICAL GENERATORS) |
506 | 0.26 |
| 39 | RAILWAY RELATED
COMPONENTS |
254 | 0.13 |
| 40 | PAPER AND PULP (INCLUDING PAPER PRODUCTS) | 222 | 0.11 |
| 41 | CEMENT AND GYPSUM
PRODUCTS |
214 | 0.11 |
| 42 | EARTH-MOVING MACHINERY | 133 | 0.07 |
| 43 | MACHINE TOOLS | 115 | 0.06 |
| 44 | CERAMICS | 108 | 0.05 |
| 45 | SCIENTIFIC INSTRUMENTS | 107 | 0.05 |
|
46 |
TEA AND COFFEE (PROCESSING
& WAREHOUSING COFFEE & RUBBER) |
89 |
0.05 |
| 47 | VEGETABLE OILS AND
VANASPATI |
86 | 0.04 |
| 48 | COMMERCIAL, OFFICE &
HOUSEHOLD EQUIPMENTS |
83 | 0.04 |
| 49 | DIAMOND,GOLD ORNAMENTS | 66 | 0.03 |
| 50 | TIMBER PRODUCTS | 53 | 0.03 |
| 51 | LEATHER,LEATHER GOODS AND
PICKERS |
35 | 0.02 |
| 52 | FERTILIZERS | 30 | 0.02 |
| 53 | SUGAR | 26 | 0.01 |
| 54 | GLUE AND GELATIN | 16 | 0.01 |
| 55 | DYE-STUFFS | 10 | 0.01 |
| 56 | DEFENCE INDUSTRIES | 8 | 0 |
| 57 | INDUSTRIAL INSTRUMENTS | 2 | 0 |
| 58 | BOILERS AND STEAM
GENERATING PLANTS |
1 | 0 |
| Gross-Total | 196,085 |


