WATER QUALITY UNDER JJM
Questions :
Will the Minister of JAL SHAKTI be pleased to state:
- the efforts made by Government to ensure the quality of water to be supplied to houses under Jal Jeevan Mission (JJM) in the country including Haryana;
- whether the quality of water supplied to the houses is being checked from time to time under Jal Jeevan Mission;
- if not, whether Government has proposed any scheme for this purpose;
- whether Government has conducted any study which reveals the positive changes occurring in the lives of women by Jal Jeevan Mission; and
- if so, the details thereof?
ANSWER
THE MINISTER OF STATE FOR JAL SHAKTI (SHRI PRAHLAD SINGH PATEL)
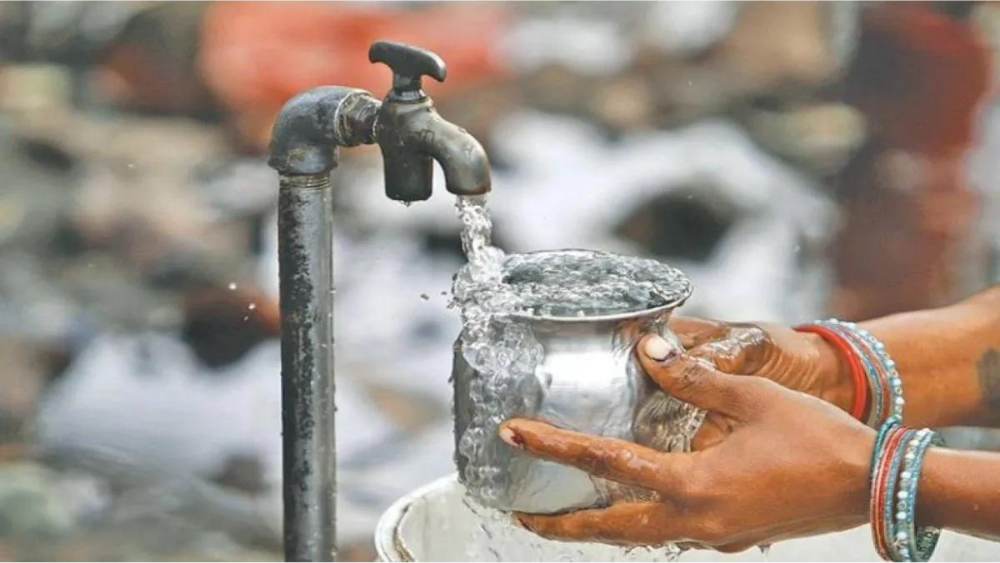
- to (c) Government of India is implementing Jal Jeevan Mission (JJM) – Har Ghar Jal, since August, 2019, in partnership with States, to make provision of potable tap water supply in adequate quantity, of prescribed quality and on regular & long-term basis to every rural household by 2024. Under Jal Jeevan Mission, as per existing guidelines, Bureau of Indian Standards’ IS:10500 standard is to be adopted for ensuring safe drinking water supply.
At the time of announcement of Jal Jeevan Mission, 3.23 Crore (17%) rural households were reported to have tap water connections. As reported by States/UTs, more than 7.88 crore rural households have been provided with tap water connections since the announcement of JJM. Thus, as on 09.02.2023, out of 19.39 Crore rural households in the country, 11.12 Crore (57.36%) households are reported to have tap water supply in their homes. Further, Haryana State has become ‘Har Ghar Jal State’, as all the 30.41 lakh rural households in the State have tap water supply in their homes. State/ UT-wise details are at Annex-I.
Under JJM, while allocating the funds to States/ UTs, 10% weightage is given to the population residing in habitations affected by chemical contaminants. States/ UTs have been advised to plan and implement piped water supply schemes of bulk water transfer based on safe water sources such as surface water sources or alternative safe ground water sources for the villages with water quality issues.
Since, planning, implementation and commissioning of piped water supply scheme based on a safe water source may take time, purely as an interim measure, States/ UTs have been advised to install community water purification plants (CWPPs) especially in Arsenic and Fluoride affected habitations to provide potable water to every household at the rate of 8–10 litre per capita per day (lpcd) to meet their drinking and cooking requirements.
States/UTs have been advised to undertake testing of water quality on a periodic basis i.e. once in year for chemical and physical parameters, and twice in a year for bacteriological parameters and take remedial action wherever necessary, to ensure that the water supplied to households is of prescribed quality.
To enable States/ UTs to test water samples for water quality, and for sample collection, reporting, monitoring and surveillance of drinking water sources, an online JJM – Water Quality Management Information System (WQMIS) portal has been developed. As reported by States/UTs on WQMIS, more than 45.04 lakh water samples have been tested in the water testing laboratories and 79.68 lakh water samples using Field Testing Kits, during 2022-23. The State–wise details of water quality test reported through WQMIS are available in public domain on JJM Dashboard and can also be accessed at:
https://ejalshakti.gov.in/WQMIS/Main/report
As reported by States/UTs, as on date, there are 2,076 drinking water quality testing laboratories at different levels viz. State, district, sub-division and/ or block level in the country. To encourage water quality testing to ensure potable drinking water supply, States/ UTs have opened water quality testing laboratories to general public for testing of their water samples at a nominal rate.
States/ UTs have been advised to identify and train 5 persons preferably women from every village to conduct water quality testing using FTKs/ bacteriological vials at village level and report the same on the WQMIS portal. So far, as reported by states/UTs, about 18.18 lakh women have been trained.
(d) & (e) In line with the operational guidelines for the implementation of Jal Jeevan Mission, this department through a 3rd party agency, undertakes assessment of functionality of tap connections provided to rural households as well as public institutions viz. schools, anganwaadi centres, etc. Last such assessment have been carried out in 2021-22 and according to that, about 79% of the surveyed household wherein female members used to fetch water prior to the installation of the House hold tap water connection, reported a reduction in drudgery in the collection of water after the installation of the tap connections. Further, about 26 percent of the surveyed households reported improvement in attendance of school going girls.
Annex-I
Annex referred in the reply to Rajya Sabha Unstarred Question No. 1194# answered on 13.02.2023
State/ UT-wise status of tap water connections in rural households
(As on 09.02.2023)
(Number in lakhs)
| S.
No. |
State/ UT | Total rural HHs as on date | Rural HHs with tap water supply as on
15.8.2019 |
Rural HHs with tap water supply | |
| No. | In% | ||||
| 1. | A & N Islands | 0.62 | 0.29 | 0.62 | 100.00 |
| 2. | Andhra Pradesh | 95.18 | 30.74 | 65.56 | 68.88 |
| 3. | Arunachal | 2.22 | 0.23 | 1.57 | 70.81 |
| 4. | Assam | 67.23 | 1.11 | 29.02 | 43.17 |
| 5. | Bihar | 166.30 | 3.16 | 158.99 | 95.61 |
| 6. | Chhattisgarh | 50.08 | 3.20 | 19.32 | 38.58 |
| 7. | DNH & DD | 0.85 | 0.00 | 0.85 | 100.00 |
| 8. | Goa | 2.63 | 1.99 | 2.63 | 100.00 |
| 9. | Gujarat | 91.18 | 65.16 | 91.18 | 100.00 |
| 10. | Haryana | 30.41 | 17.66 | 30.41 | 100.00 |
| 11. | Himachal | 17.09 | 7.63 | 16.70 | 97.74 |
| 12. | Jammu & | 18.68 | 5.75 | 10.63 | 56.89 |
| 13. | Jharkhand | 61.19 | 3.45 | 18.56 | 30.34 |
| 14. | Karnataka | 101.18 | 24.51 | 62.49 | 61.77 |
| 15. | Kerala | 70.70 | 16.64 | 32.52 | 46.00 |
| 16. | Ladakh | 0.43 | 0.01 | 0.31 | 71.82 |
| 17. | Lakshadweep | 0.13 | 0.00 | 0.00 | 0.00 |
| 18. | Madhya | 119.90 | 13.53 | 56.44 | 47.07 |
| 19. | Maharashtra | 146.73 | 48.44 | 106.91 | 72.86 |
| 20. | Manipur | 4.52 | 0.26 | 3.43 | 75.88 |
| 21. | Meghalaya | 6.35 | 0.05 | 2.88 | 45.34 |
| 22. | Mizoram | 1.33 | 0.09 | 0.99 | 74.51 |
| 23. | Nagaland | 3.66 | 0.14 | 2.21 | 60.29 |
| 24. | Odisha | 88.56 | 3.11 | 50.53 | 57.06 |
| 25. | Puducherry | 1.15 | 0.94 | 1.15 | 100.00 |
| 26. | Punjab | 34.26 | 16.79 | 34.24 | 99.96 |
| 27. | Rajasthan | 107.64 | 11.74 | 33.78 | 31.38 |
| 28. | Sikkim | 1.32 | 0.70 | 1.04 | 79.08 |
| 29. | Tamil Nadu | 125.51 | 21.76 | 74.52 | 59.37 |
| 30. | Telangana | 53.98 | 15.68 | 53.98 | 100.00 |
| 31. | Tripura | 7.42 | 0.25 | 4.36 | 58.71 |
| 32. | Uttar Pradesh | 262.76 | 5.16 | 78.27 | 29.79 |
| 33. | Uttarakhand | 14.94 | 1.30 | 10.87 | 72.72 |
| 34. | West Bengal | 182.72 | 2.15 | 55.15 | 30.18 |
| Total | 1,938.84 | 3,23.63 | 1,112.12 | 57.36 | |


